
Introduction
Every day, asset-intensive organizations generate mountains of engineering, operational, and sensor data. Pump vibration readings. Maintenance logs. P&ID revisions. Inspection records. The raw volume keeps growing.
But raw data rarely drives good decisions on its own. A PwC survey of over 1,100 executives found that only 4% of companies were truly data-driven, with many leaders still leaning on instinct over evidence for major calls.
More often, the real challenge is where the data lives: scattered across legacy systems, spreadsheets, and disconnected platforms that don't talk to each other. Inconsistent formats and missing values make it hard to trust, let alone analyze.
This article breaks down what data transformation and data analytics actually mean, how they work together, and why getting this foundation right matters for safety, compliance, and asset performance.
Key Takeaways
- Raw, messy data must be standardized through transformation before meaningful analytics can happen
- Data analytics uncovers patterns through four types: descriptive, diagnostic, predictive, and prescriptive
- The full workflow runs through four stages: collection, transformation, analysis, interpretation
- ETL and ELT approaches affect the speed, scale, and cost of your entire analytics pipeline
- Clean, well-transformed data underpins predictive maintenance, digital twins, and regulatory compliance
What Is Data Transformation?
Data transformation is the process of converting raw data from multiple, often incompatible sources into a clean, standardized format that's ready for analysis. Think of it as translation work: taking information written in a dozen different "dialects" and turning it into one language everyone can use.
Raw data causes real problems when left untouched. Inconsistent formats, missing values, duplicate records, and siloed systems all chip away at reliability. The cost adds up fast. Poor data quality costs organizations an average of $12.9 million annually, according to IBM's research on data quality costs.
Simple vs. Complex Transformations
Transformation work generally falls into two buckets:
Simple transformations clean up data within its existing structure:
- Cleansing (removing duplicate maintenance entries)
- Standardization (converting all timestamps to one format)
- Aggregation (rolling up hourly sensor readings into daily averages)
- Filtering (excluding sensor readings outside normal operating range)
Complex transformations reshape or combine data more significantly:
- Integration (merging equipment records from separate ERP and CMMS systems)
- Migration (moving legacy tag registers into a new asset information platform)
- Enrichment (adding manufacturer specifications to bare equipment tags)
- Normalization (scaling varied sensor units to a common reference)
ETL vs. ELT: Two Paths to the Same Goal
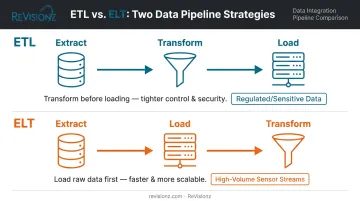
Organizations generally choose between two methodologies. ETL (Extract, Transform, Load) transforms data before it hits the target system, offering tighter control and security through encryption during processing, according to IBM's comparison of ETL and ELT.
ELT (Extract, Load, Transform) loads raw data first and transforms it later. This trades some upfront control for speed and scalability, particularly valuable in high-volume industrial environments.
Neither approach is universally "better." Regulated industries handling sensitive process safety data often lean ETL. Organizations managing massive sensor streams often favor ELT for its throughput.
This choice matters most for legacy engineering and asset data. Tag registers, P&IDs, and maintenance records are frequently scattered across disconnected systems that were never designed to talk to one another.
Before that information can feed a digital twin or an analytics platform, it has to be pulled together, cleaned, and standardized.
Skip this step, and even the most sophisticated analytics tool is just running calculations on noise.
Common Data Transformation Techniques
If you're evaluating tools or vendors, these five terms come up constantly:
- Cleansing: fixing errors and removing duplicate records
- Normalization: standardizing values to a common scale or format
- Enrichment: adding relevant external data to fill gaps
- Aggregation: combining multiple records into summarized values
- Encoding: converting categorical data (like equipment type) into numerical formats for modeling
Recognizing these terms helps you ask sharper questions when scoping a data project or selecting a technology partner.
What Is Data Analytics?
Data analytics is the practice of examining transformed data to identify patterns, trends, and relationships that inform decisions. Where transformation prepares the data, analytics is what actually generates insight from it. They're distinct steps, but neither works well without the other.
A mature analytics program combines four types:
- Descriptive analytics: what happened (historical reporting, KPI comparisons)
- Diagnostic analytics: why it happened (root-cause analysis, data mining)
- Predictive analytics: what could happen next (machine learning, statistical forecasting)
- Prescriptive analytics: what action to take (scenario testing, AI-driven recommendations)
Most organizations only ever reach the first rung. They build dashboards that report what already happened, then stop. That leaves significant value on the table.
Diagnostic, predictive, and prescriptive analytics are where the real operational payoff shows up. But they require more mature data foundations and analytical capability to execute well.
For asset-intensive operators, this distinction isn't academic. Applying predictive and prescriptive analytics to equipment sensor and maintenance data can flag a potential bearing failure or corrosion issue weeks before it happens, rather than after a shutdown.
That's the difference between a maintenance program that reacts to failures and one that prevents them.
The Data-to-Insight Workflow: How Transformation and Analytics Work Together
Transformation and analytics don't operate in isolation. They're two links in a longer chain.
- Data collection & discovery — Gather raw data from sensors, CMMS/ERP systems, and engineering databases. Then profile it to understand structure and spot quality issues early.
- Data transformation & cleansing — Apply the cleansing, mapping, and standardization techniques covered above to prepare data for storage and analysis.
- Data analysis — Run descriptive, diagnostic, predictive, or prescriptive techniques against the transformed dataset to generate actionable insight.
- Interpretation & visualization — Present findings through dashboards, reports, or automated alerts so decision-makers can act, not just observe.
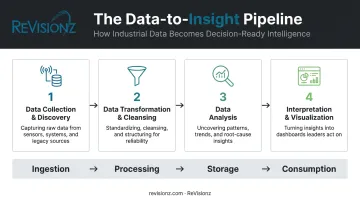
Modern analytics architectures increasingly stack these stages into layered systems, ingestion, processing, storage, and consumption, so data moves through the pipeline with less manual handoff at each step. This layered approach is detailed in AWS's serverless data analytics reference architecture.
This workflow is also becoming more automated end-to-end. AI-assisted tools now accelerate each stage, from flagging data quality issues during collection to generating draft visualizations. The payoff: less manual effort at scale and a shorter path from raw data to usable insight.
Business Benefits of Data Transformation & Analytics
These improvements translate into concrete advantages across the organization:
- Better, faster decision-making: Standardized, trustworthy data reduces reliance on gut instinct, so engineering, operations, and maintenance teams can make calls based on what the data actually shows.
- Stronger safety, compliance, and asset performance: Real-time, well-governed data strengthens regulatory reporting and supports lifecycle asset management across the full asset base, not just a handful of critical units.
- A foundation for advanced use cases: Predictive maintenance, digital twins, and AI-powered insights all depend on clean, lifecycle-ready data. Without it, these initiatives stall before they start.
This is precisely the gap ReVisionz's AI-powered Main Information Contractor+ (MIC+) service is built to close. MIC+ transforms unstructured engineering and asset data into lifecycle-ready information, repairing gaps and aligning systems in the process. That work lets the data fuel predictive analytics and digital twin programs instead of sitting idle in a legacy system.
The result directly improves the return on technology investments already made in EAM, ERP, or engineering platforms.
Common Challenges & Best Practices
Data quality and consistency. Inconsistent naming conventions, disparate source systems, and weak governance create duplicated or conflicting datasets. The fix isn't glamorous: establish standardized data models and assign clear data ownership so someone is actually accountable for accuracy.
Scalability and security. As data volumes and use cases multiply, transformation processes have to scale without cutting corners on security. According to IBM's 2025 Cost of a Data Breach Report, the global average cost of a breach reached $5.12 million in 2025, and poor governance around access controls is frequently a contributing factor.
Partner with people who've done this before. Complex, multi-site asset environments, think dozens of facilities with millions of asset tags and decades of engineering documents, benefit enormously from proven data migration and enrichment methodologies. Trying to build this capability from scratch, in-house, on a live operating asset is a hard way to learn expensive lessons.
Working with an experienced digital asset consultancy like ReVisionz helps organizations sidestep common transformation pitfalls and get to value faster. This is especially valuable when the goal is connecting engineering, operational, and IT systems that were never designed to work together.

Frequently Asked Questions
What is data transformation in data analytics?
Data transformation is the preparatory step that converts raw, inconsistent data into a structured, standardized format. That clean data then becomes the direct input for data analytics processes.
What are the 4 stages of data analytics?
The four stages are collection (gathering raw data), transformation (cleansing and standardizing it), analysis (applying analytical techniques), and interpretation/visualization (presenting findings for decision-making).
What are the top 3 skills for a data analyst?
Proficiency in SQL and a programming language like Python or R tops the list. Employers also look for comfort with data visualization and BI tools, plus strong statistical or analytical thinking.
What is the difference between data transformation and data analytics?
Transformation prepares and cleans data so it's trustworthy and usable. Analytics then interprets that data to generate insights and inform decisions. They're sequential, complementary steps in the same pipeline.
What are the main types of data analytics?
Descriptive analytics shows what happened, diagnostic analytics explains why, predictive analytics forecasts what's likely next, and prescriptive analytics recommends what action to take.
How does data transformation improve business decision-making?
It ensures data is reliable and consistent, so decisions rely on accurate information rather than guesswork. This matters most in asset performance and compliance decisions, where errors carry real operational risk.