Introduction
Asset-intensive operations now generate more condition data than most teams know what to do with. Sensors, historians, and CMMS platforms produce a constant stream of readings, alarms, and work orders. Yet many organizations still cannot turn that flood of data into faster, better decisions.
The common trap: analytics programs stay locked inside the maintenance function. They improve alerts and shorten response times, but production scheduling, procurement, and capital planning keep operating reactively, just as they always have.
Unplanned downtime alone costs Fortune Global 500 industrial companies an estimated $1.4 trillion annually, or roughly 11% of revenue, according to Siemens' 2024 True Cost of Downtime report. That scale of loss reaches far beyond the maintenance department, touching operations, finance, and the executive suite.
This guide breaks down the four types of asset analytics, the KPIs that prove they are working, and how to connect analytics outputs to real decisions across the asset lifecycle.
Key Takeaways
- Asset performance analytics turns condition data into actionable insight across production, maintenance, and procurement
- Four analytics types (descriptive, diagnostic, predictive, and prescriptive) demand increasing data maturity for deeper value
- MTBF, MTTR, and OEE show whether analytics investment improves reliability, not just dashboards
- The biggest APM gap is routing failure: condition signals rarely reach the cross-functional decisions that need them
- Clean asset data and cross-functional governance determine whether analytics produces enterprise-wide financial results
What Is Asset Performance Analytics?
Asset performance analytics combines sensor data, maintenance history, and operational records with analytical techniques to produce continuous, actionable insight into asset health. That insight extends beyond a single failure event to reveal downstream impact on availability, cost, and safety.
Three related terms get confused constantly:
- Asset performance monitoring: the real-time data collection layer (sensors, alarms, condition readings)
- Asset performance analytics: the interpretation and prediction layer built on that data
- Asset performance management (APM): the overarching strategy combining technology, process, and people to act on the insight
Why the Distinction Matters in Heavy Industry
In oil & gas, chemicals, and mining, this distinction isn't academic. Unplanned downtime and compliance failures carry outsized financial and safety consequences.
Consider the scale: Siemens/Senseye estimates the average large industrial plant loses $253 million per year to unplanned downtime, with an idle automotive production line costing roughly $695 million annually compared to $59 million for heavy industry. Monitoring tells you something's wrong. Only analytics, paired with a management structure that acts on it, prevents the next failure from becoming a budget line item.
The Four Types of Asset Performance Analytics
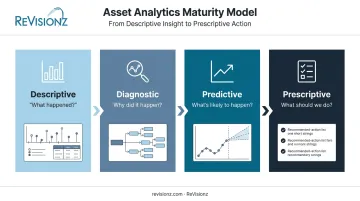
Analytics maturity follows a predictable path: descriptive, diagnostic, predictive, and prescriptive. Each level demands more sophisticated data and delivers progressively higher value.
| Analytics Type | Core Question | Output |
|---|---|---|
| Descriptive | What happened? | Historical condition and downtime patterns |
| Diagnostic | Why did it happen? | Root causes and cross-asset correlations |
| Predictive | What's likely to happen? | Failure probability, remaining useful life |
| Prescriptive | What should we do? | Recommended action, timing, and tradeoffs |
Descriptive and Diagnostic Analytics
Descriptive analytics summarizes historical performance through dashboards and KPI reports. It's the foundational layer most CMMS and EAM systems already deliver. Nothing exotic, just clean visibility into what already happened.
Diagnostic analytics goes further. It investigates why failures occurred through root cause analysis and correlation across datasets. This often uncovers non-obvious relationships — a pump failing every time an upstream compressor cycles a certain way, for example.
Predictive and Prescriptive Analytics
Predictive analytics uses statistical modeling and machine learning to forecast future asset health. This is what enables condition-based maintenance triggers instead of rigid, fixed-interval schedules.
Prescriptive analytics recommends specific actions and weighs tradeoffs across scheduling, procurement, and capital decisions. Few organizations have actually reached this level. LNS Research found that 70% of "Industrial Transformation leaders" had implemented APM software at scale, compared to just 36% of followers. That figure measures deployment, not prescriptive maturity, which remains rarer still.
Don't skip steps. Jumping straight to prescriptive analytics without a solid diagnostic and predictive foundation is one of the most common reasons APM investments underdeliver. Each layer depends on the one below it.
How to Measure Asset Performance: Key KPIs
No single metric tells the whole story. Measuring asset performance requires combining reliability, availability, and efficiency indicators together.
MTBF and MTTR
Mean Time Between Failures (MTBF) measures total operating time divided by number of failures. A rising MTBF trend signals improving reliability, though it excludes planned maintenance, so it only reflects unplanned failure behavior.
Mean Time to Repair (MTTR) measures total active repair time divided by number of repairs. Better diagnostics and predictive maintenance directly reduce MTTR because teams arrive at a failure already knowing what's wrong and with parts in hand.
Overall Equipment Effectiveness (OEE)
OEE combines three components into one composite productivity measure:
- Availability: Run Time / Planned Production Time
- Performance: Ideal Cycle Time × Total Count / Run Time
- Quality: Good Count / Total Count
Multiply all three together, and you get a single number capturing stoppages, speed loss, and rework in one view.
Beyond the Maintenance Floor
Enterprise-level indicators matter just as much: unplanned downtime hours, emergency procurement frequency, and maintenance cost per unit of production.
Siemens/Senseye found the average large plant loses 326 hours per year to unplanned downtime (about 27 hours a month across 25 separate incidents), with average restart time climbing from 49 minutes in 2019 to 81 minutes in 2024. That trend alone suggests recovery processes, not just failure frequency, need attention.
Connecting Analytics to Operational Decisions
Analytics only creates enterprise value when condition signals reach the operational and financial decisions that depend on asset availability, before those decisions get locked in. A predictive model that fires an alert nobody routes anywhere is just noise with better math behind it.
Production Scheduling
Timely availability forecasts let schedulers build committed production plans around actual asset condition, not react after a failure blows up the schedule. When a critical pump shows early degradation, that signal needs to reach the scheduling desk, not just the maintenance queue.
Procurement and Spare Parts
Early condition signals allow parts sourcing through standard lead times and planned channels instead of costly, schedule-risky emergency procurement. Waiting for a failure to trigger a parts order almost guarantees paying rush freight and expedite fees.
Capital Planning
Degradation-based signals support replace-on-condition decisions instead of rigid age-based replacement schedules. This avoids two expensive mistakes at once: premature capital spend on assets that still have useful life, and extended risk exposure from running assets past their reliable window.
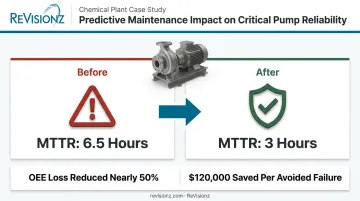
One chemical plant's experience illustrates the payoff. Online condition monitoring on critical pumps without backups gave operators hours of warning before failure, letting teams prepare and accelerate the repair response.
The result, according to McKinsey's analysis of predictive maintenance in chemicals: MTTR fell from 6.5 to 3 hours, OEE loss dropped nearly 50%, and the plant saved $120,000 per avoided failure.
Where Programs Commonly Fall Short
Most APM deployments improve maintenance response but rarely reach adjacent functions. The culprit is usually siloed data and governance — not a lack of technology. Scheduling, procurement, and capital planning keep operating on assumed availability rather than actual, measured availability.
The gap shows up in the numbers. McKinsey surveyed 100 senior leaders across oil and gas, manufacturing, and other sectors: 99% had undertaken a maintenance transformation and 84% used predictive maintenance for critical assets, yet 62% still reported maintenance costs rising faster than inflation, according to McKinsey's research on asset productivity.
Adoption doesn't guarantee results.
| Function | Reactive Approach | Analytics-Connected Approach |
|---|---|---|
| Maintenance timing | Fixed intervals or run-to-failure | Condition-triggered, risk-ranked |
| Capital replacement | Age-based, calendar-driven | Degradation-based, replace-on-condition |
| Spare parts stocking | Emergency orders after failure | Planned sourcing within lead time |
| Production scheduling | Reactive rework after disruption | Availability-forecasted planning |
Building an Effective Asset Performance Analytics Program
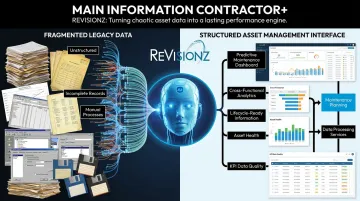
Predictive and prescriptive models cannot function reliably on fragmented, unstructured asset data. That's the foundational step most organizations underestimate: getting asset data clean, structured, and lifecycle-ready before layering analytics on top.
Data First, Governance Second
Once the data foundation is solid, the next challenge is governance : specifically, routing condition signals to operations, procurement, and finance simultaneously, timed to each function's own decision horizon. A signal that reaches maintenance in real time but hits procurement three weeks later, after the standard lead-time window has closed, hasn't actually connected anything.
Many owner-operators bring in experienced digital asset transformation partners to bridge this gap rather than building it alone.
ReVisionz's AI-powered Main Information Contractor+ (MIC+) service and Asset Information Management (AIM) practice target this exact problem: converting unstructured asset data into lifecycle-ready information. That converted data feeds:
- Predictive maintenance programs
- Cross-functional analytics
- Day-to-day operational decision-making
The underlying methodology draws on data migration and enrichment practices built for asset-heavy sectors like oil & gas, chemicals, and mining, where fragmented legacy records are the norm rather than the exception.
Treat It as an Evolving Capability
Mature programs don't set KPIs and models once and walk away. They revisit them as the asset base ages, new equipment gets added, and organizational needs shift. A model tuned for a plant's original equipment mix will drift out of relevance as that mix changes. Governance has to account for that, not just the initial rollout.
Frequently Asked Questions
How do you measure asset performance?
Combine core reliability KPIs (MTBF, MTTR, and OEE) with enterprise metrics like unplanned downtime hours and utilization rate. No single number captures the full picture; you need reliability, availability, and efficiency data together.
What is asset performance monitoring?
Monitoring is the real-time data collection layer: sensors, alarms, and condition readings feeding into your systems. It's distinct from analytics, which interprets that data, and from management, which acts on it.
What is performance analytics?
Performance analytics applies analytical techniques to operational data to generate insight and guide decisions. It ranges from descriptive summaries of what happened to prescriptive recommendations for what to do next.
What are the four types of asset analytics?
Descriptive, diagnostic, predictive, and prescriptive. Each level requires more data sophistication and delivers deeper decision-making value, moving from "what happened" to "what should we do about it."
What's the difference between asset performance management and asset performance analytics?
APM is the broader strategy combining technology, process, and people to manage assets against business objectives. Analytics is the specific insight-generation capability that feeds decisions within that strategy.
How does asset performance analytics reduce total cost of ownership?
By connecting condition signals to maintenance, procurement, and capital planning, organizations cut emergency costs, extend useful asset life, and avoid premature capital replacement, lowering total cost of ownership across the lifecycle.