
Introduction
A data quality audit is a systematic process of evaluating data against accuracy, completeness, consistency, and reliability standards. It tells you whether the numbers, tags, and records your teams rely on are actually trustworthy.
This guide targets teams managing engineering, asset, and operational data in capital-intensive industries: oil & gas, chemicals, mining, and manufacturing.
In these environments, a mislabeled valve tag or missing criticality rating creates safety and compliance exposure that goes far beyond a reporting inconvenience.
Most operations teams already know they need regular data quality audits, but few use a consistent, repeatable methodology.
This article covers the step-by-step audit process, the core dimensions to measure, common issues you'll likely uncover, and what to do once the audit is finished.
Key Takeaways
- A data quality audit confirms your data is accurate, complete, consistent, and decision-ready
- Poor data quality creates safety, compliance, and operational risk—not just messy dashboards
- Six steps make up a reliable audit: scoping through remediation
- Audits should score six dimensions and feed continuous monitoring, not a one-time cleanup
What Is a Data Quality Audit and Why It Matters
A data quality audit is a structured, evidence-based examination of datasets against defined quality standards. The goal is verified, trustworthy data that stakeholders and systems can rely on for decisions, reporting, and compliance.
Three related terms often get blurred together:
- Data quality audit: Identifies existing issues in current data
- Data quality assurance: The ongoing processes that prevent future issues
- Data governance: Defines the rules, ownership, and decision rights around data
The Cost of Skipping the Audit
Gartner research puts the average annual cost of poor data quality at $12.9 million per organization. At the macro level, bad data is estimated to cost the U.S. economy $3.1 trillion per year, according to IBM research cited by Harvard Business Review.
Those are cross-industry figures, not asset-specific benchmarks, but the pattern holds in industrial settings too. Without regular audits, asset-intensive organizations typically see:
- Incomplete handover data that arrives from capital projects with gaps in tags, documents, or criticality fields
- Digital twins that drift from reality because the source data feeding them was never verified
- Compliance exposure during inspections, when auditors find records that don't match physical assets
How to Conduct a Data Quality Audit: A Step-by-Step Process
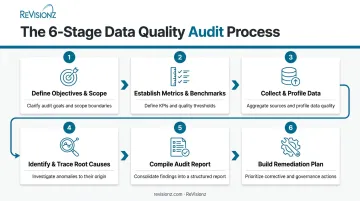
The audit process moves through six stages: defining objectives and scope, establishing quality benchmarks, collecting and profiling data, identifying and tracing root causes, compiling the audit report, and building a remediation plan. Skip a step and you end up with a list of problems and no plan to fix them.
Step 1: Define Audit Objectives and Scope
Start by setting specific, measurable objectives. Are you checking equipment criticality data before a turnaround? Validating tag consistency ahead of a system migration?
Next, identify which systems and datasets belong in scope:
- Asset registers and equipment hierarchies
- P&ID data and engineering drawings
- ERP and CMMS records (SAP, Maximo, Oracle)
- Historian and maintenance history logs
Prioritize by business or safety impact. A gap in pressure-vessel inspection dates matters more than a typo in a spare-parts description.
Step 2: Establish Data Quality Metrics and Benchmarks
Before you touch the data, define what "good" looks like. For each relevant dimension, set a quantifiable threshold. For example: 95% of equipment records must have complete criticality data, or 100% of safety-critical tags must match across CMMS and engineering systems.
Setting benchmarks first prevents the audit from becoming a subjective exercise. It also gives you a clear pass/fail line for later reporting.
Step 3: Collect and Profile the Data
Pull data from the source systems identified in Step 1. Profiling techniques help you understand structure, value ranges, and obvious anomalies before deeper analysis begins.
This step typically surfaces:
- Fields with unexpectedly high null rates
- Value distributions that don't match expected ranges
- Formatting inconsistencies across systems holding the same data
Step 4: Identify, Document, and Trace Root Causes
Log every issue found: the record, the field, the dimension violated, and the affected system. Then trace it back. Was it a manual entry error? A broken integration between two systems? The absence of a governance rule that should have caught it?
Root-cause tracing is what separates a real audit from a spreadsheet of complaints. Without it, you fix symptoms and the same errors reappear next quarter.
Step 5: Compile an Audit Report with Findings and Business Impact
Structure the report so both leadership and technical teams get what they need:
- Executive summary - the headline findings and business risk in plain language
- Methodology - scope, benchmarks, and how data was profiled
- Detailed findings by dimension - accuracy, completeness, consistency, and so on
- Business impact assessment - safety, compliance, and operational consequences
- Prioritized recommendations - what to fix first and why
Step 6: Build a Remediation Plan and Assign Ownership
Prioritize fixes using an impact-versus-effort lens. Quick wins go first. Also assign a named owner and a deadline to each item, not a department. Finally, validate that corrections were actually implemented, not just marked complete.
The Core Data Quality Dimensions Every Audit Should Measure
Every audit should score data against six dimensions rather than producing one overall "quality score." A single score hides where the actual risk lives.
- Accuracy: Does the data reflect real-world conditions? An equipment spec sheet should match the physical asset on the floor.
- Completeness: Are required fields populated? Missing maintenance history or criticality ratings are common gaps.
- Consistency: Does the same data element match across systems? An asset tag should read identically in the CMMS and on the P&ID.
- Timeliness: Is the data current enough for operational or safety-critical decisions? Stale inspection data delays turnaround planning.
- Uniqueness: Are there duplicate equipment or asset records distorting maintenance planning and reporting? Duplicate pump records double-count spare part needs.
- Validity: Does the data conform to required formats, tagging rules, or naming standards used organization-wide? Non-standard tags break automated searches.
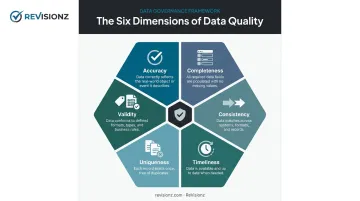
Score each dimension separately by asset class or system. A facility might score well on completeness but poorly on consistency between engineering and maintenance systems, and that distinction changes what you fix first.
Common Data Quality Issues Uncovered During Audits
Run enough audits and the same problems keep showing up. Here's what tends to surface most often in engineering and asset data environments:
- NULL or missing values in critical fields - usually from manual entry gaps or system outages during data capture
- Schema or naming-convention inconsistencies - these tend to surface right after system migrations, upgrades, or new integrations
- Duplicate or orphaned records - equipment entries duplicated across systems, or records with no linked parent system, breaking the asset hierarchy
- Stale or outdated records - data that no longer reflects current asset conditions, creating real risk for maintenance and compliance decisions
None of these are rare edge cases. They're the predictable result of data being treated as a byproduct of project work rather than an asset in its own right.
From Audit to Action: Remediation and Continuous Data Quality Management
An audit without follow-through is money spent for a document nobody acts on. Start remediation with high-impact, low-effort fixes, the ones that close the biggest gaps with the least disruption. Then tackle the systemic issues underneath them.
Two things make fixes stick:
- Standardize governance rules. Define who owns which data, what format it must follow, and who validates changes.
- Build cleansing and enrichment into ongoing workflows. Don't fix an issue once and walk away; embed the check into the process that created the data.
One-time audits fall short for organizations running digital twin or asset information management (AIM) programs. A twin is only as good as the live data feeding it, and asset conditions change daily. Continuous monitoring, not a periodic scrub, is what sustains reliability over the asset lifecycle.
This is where a lot of internal audit programs stall. Teams have the findings but lack the structure to keep data clean after go-live. ReVisionz works with owner-operators to convert one-time audit findings into lifecycle-ready, sustained data quality through structured data migration, enrichment, and AI-powered services like MIC+.
In one multi-year engagement with an LNG operator, this approach helped consolidate more than 300,000 tags and 800,000 documents. The work also closed the governance gaps that were driving inconsistent records in the first place.
Frequently Asked Questions
What is a data quality audit?
A data quality audit is a systematic review of data against accuracy, completeness, consistency, and reliability standards. It identifies existing issues so teams know exactly where their data can and can't be trusted.
How often should a data quality audit be conducted?
Teams should review critical or safety-related datasets continuously or quarterly. Lower-impact datasets typically need audits only annually or semi-annually, depending on how fast they change.
What's the difference between a data quality audit and data quality assurance?
An audit identifies existing issues in current data. Data quality assurance is the ongoing set of processes that prevents future issues from occurring in the first place.
How long does a data quality audit typically take?
Duration depends on scope and data volume. A single dataset might take a few weeks, while enterprise-wide asset data across multiple facilities can take several months.
What tools are commonly used to run a data quality audit?
Teams typically use data profiling tools, validation and cleansing platforms, and data observability or governance software. Tool choice depends on the audit's scale and the source systems involved.
Who should be involved in a data quality audit for engineering or asset data?
You need a cross-functional team: data stewards, IT/systems staff, engineering or operations subject matter experts, and business stakeholders who own the data being reviewed. Skipping any one of these groups leaves blind spots in the findings.